Choose which types appear
Show or hide specific resource types to focus on what matters.
Works Offline
Open an RDF file with a single click. See the high-level structure, then dig into your perfect subgraph. Filter out types or run validation with ease.
One-time purchase: $19.99.
Skip the complex Docker commands. Open RDF right in your browser.
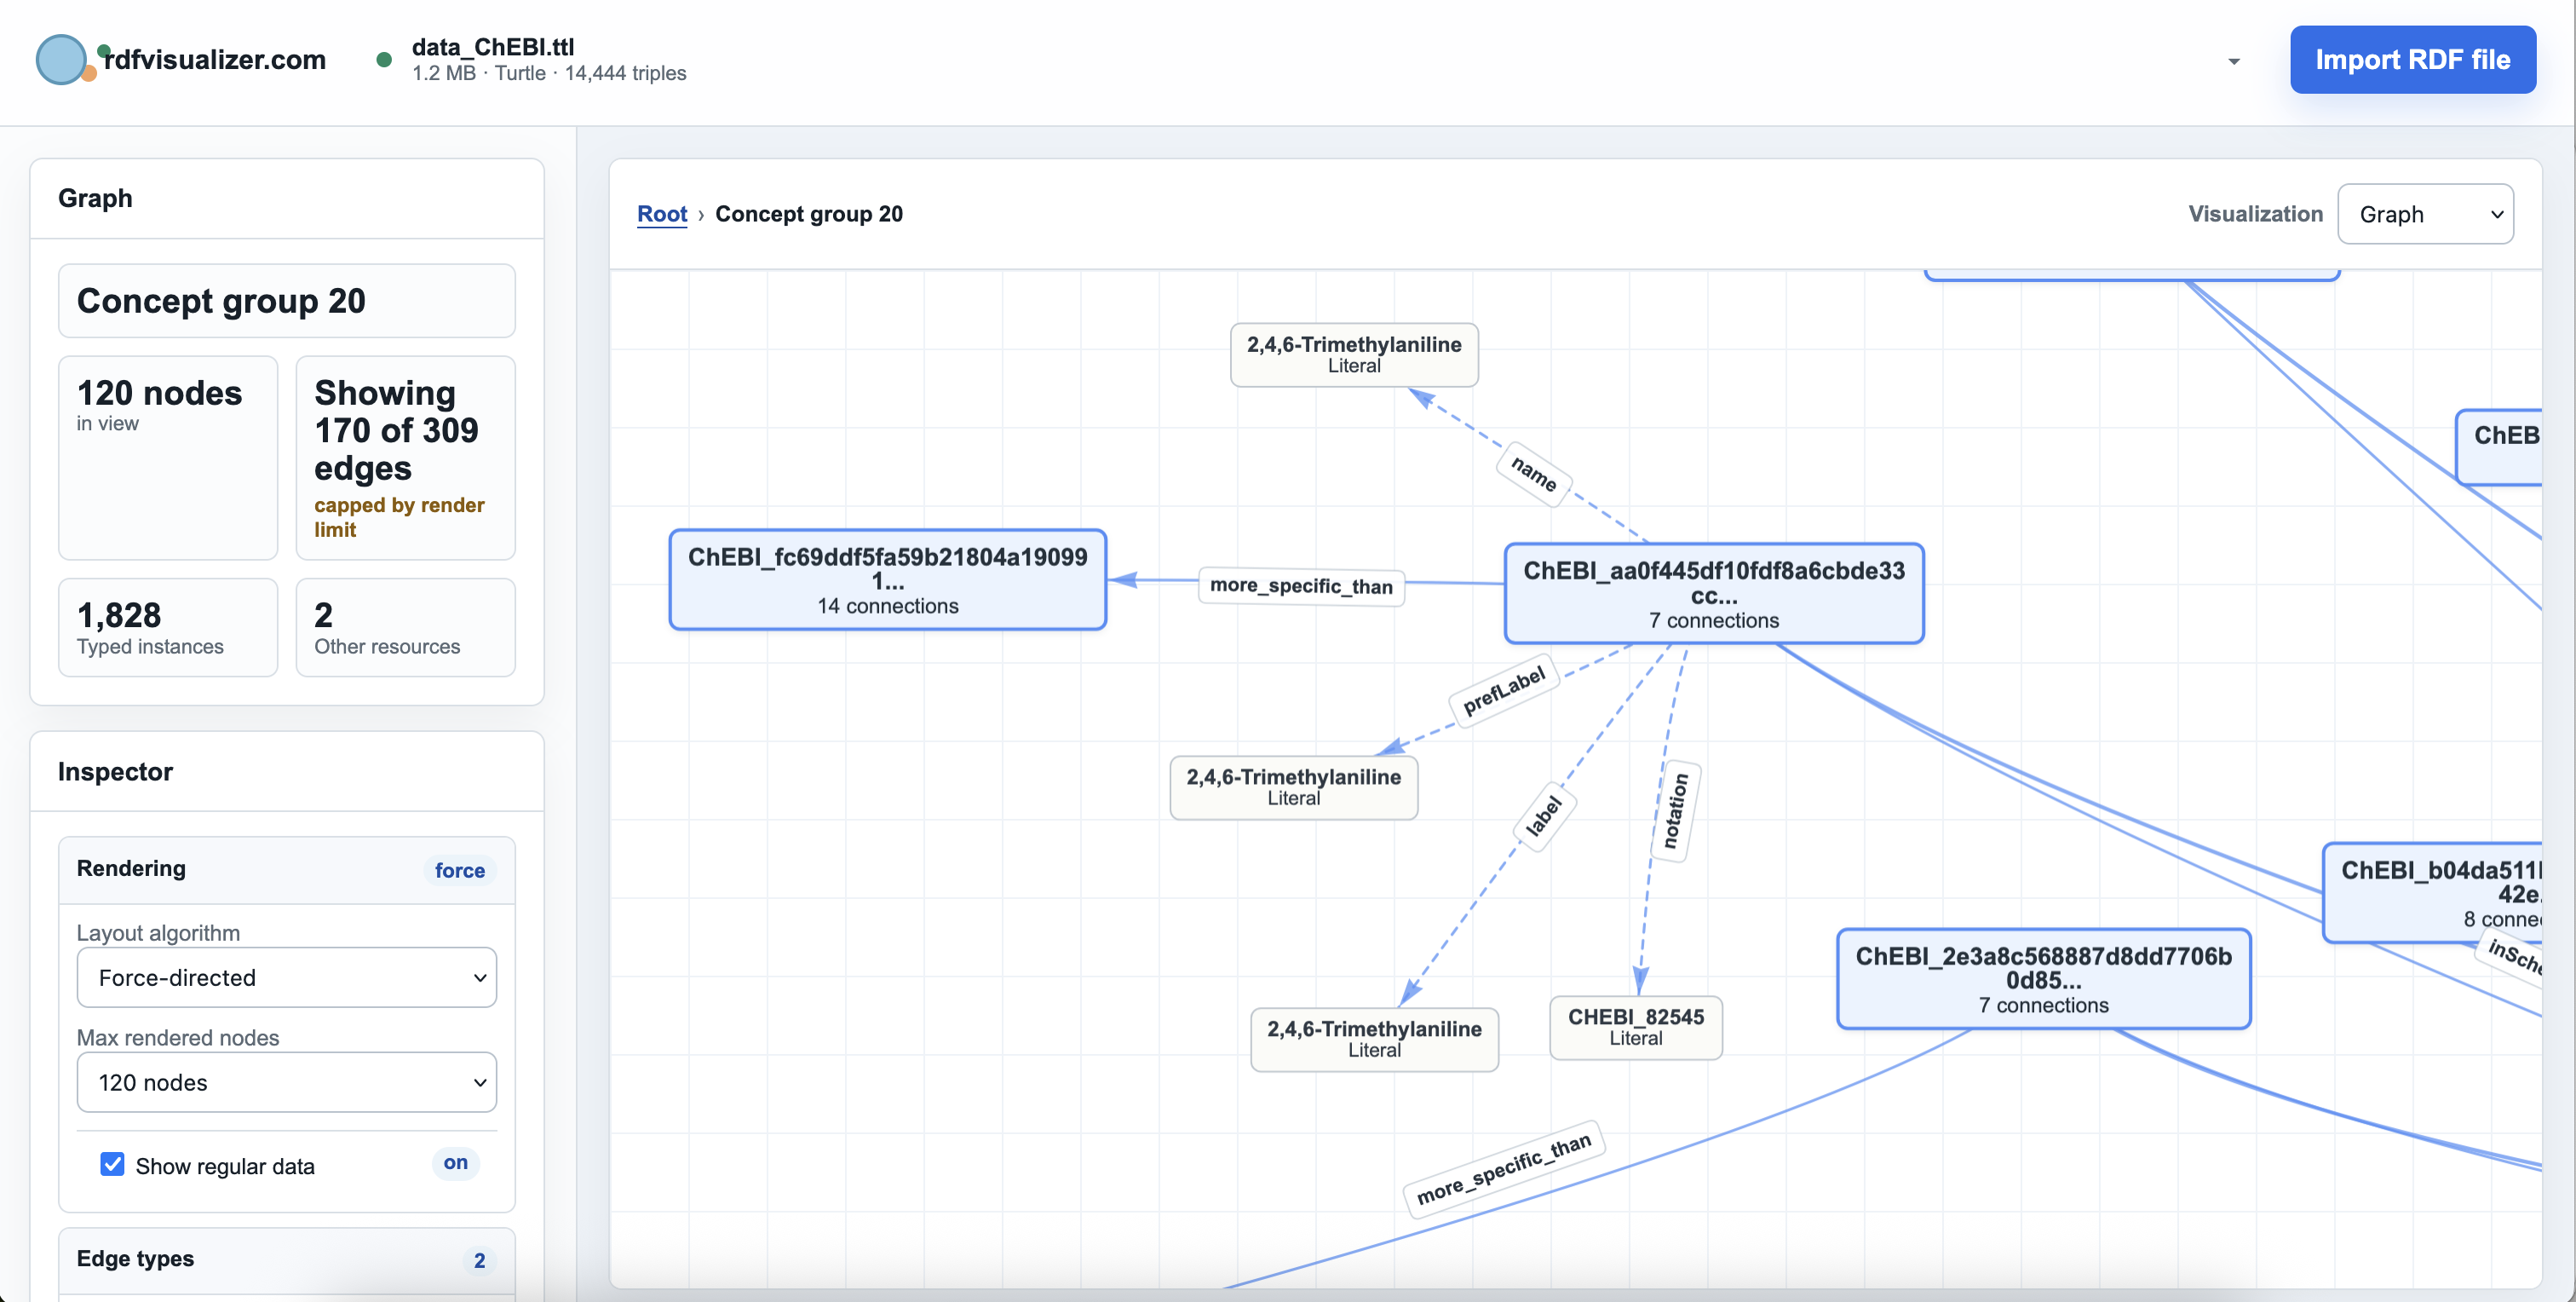
Just trying to open an RDF file, but keep ending up in dense specifications? Tired of switching between tools for different formats and tasks? It can be hard to know where to start, let alone which tool to use.
And RDF itself is hard to read. Names, dates, and other attributes sit alongside connections between resources, making it easy to lose the structure in the details.
RDF Visualizer brings the basics together: open common RDF formats, check the file, inspect its metadata, and explore it through graphs and tables. Attributes become readable columns and details, while clusters help you follow the relationships. Less time figuring out the tooling. More time understanding your data.
From graph to subgraph
Craft your perfect subgraph with controls that keep dense RDF graphs readable.
Show or hide specific resource types to focus on what matters.
Click a node or predicate to easily explore a focused subgraph.
Hover over a node to see its attributes without interrupting your exploration.
Toggle regular data to show attributes or hide them for a clearer view of connections.
Regular data versus typed data
RDF often mixes two very different ideas: facts that describe a thing, and links between things. RDF Visualizer automatically detects typed resources and treats literal-like predicates as attribute relationships, so the graph can focus on the relationships that matter.
Labels, names, identifiers, dates, and other descriptive values stay available, but they do not have to crowd every graph view.
Class membership and resource-to-resource predicates remain easy to scan, filter, and follow across the RDF graph.
Toggle regular data on or off to move between a complete graph and a cleaner view of semantic structure.
| Resource | Label | Notation | Links |
|---|---|---|---|
| ChEBI_82545 | 2,4,6-Trimethylaniline | 82545 | 7 connections |
| ChEBI_7a825038... | Concept group 20 | more_specific_than | 11 connections |
| ChEBI_fc69ddf... | Chemical entity | inScheme | 14 connections |
Built-in table view
Those attribute relationships become useful columns automatically. Search across rows, reorder columns, filter individual columns, and move between table rows and graph relationships without rebuilding the dataset in another tool.
Export filtered graphs as SVG and filtered table data as CSV with a single click.
Novel clustering algorithm
Most RDF graph viewers start by showing every connection at once. That can be useful for tiny files, but real linked data often turns into a hairy mess. RDF Visualizer groups related knowledge into clusters, then lets you drill down as the structure becomes relevant.
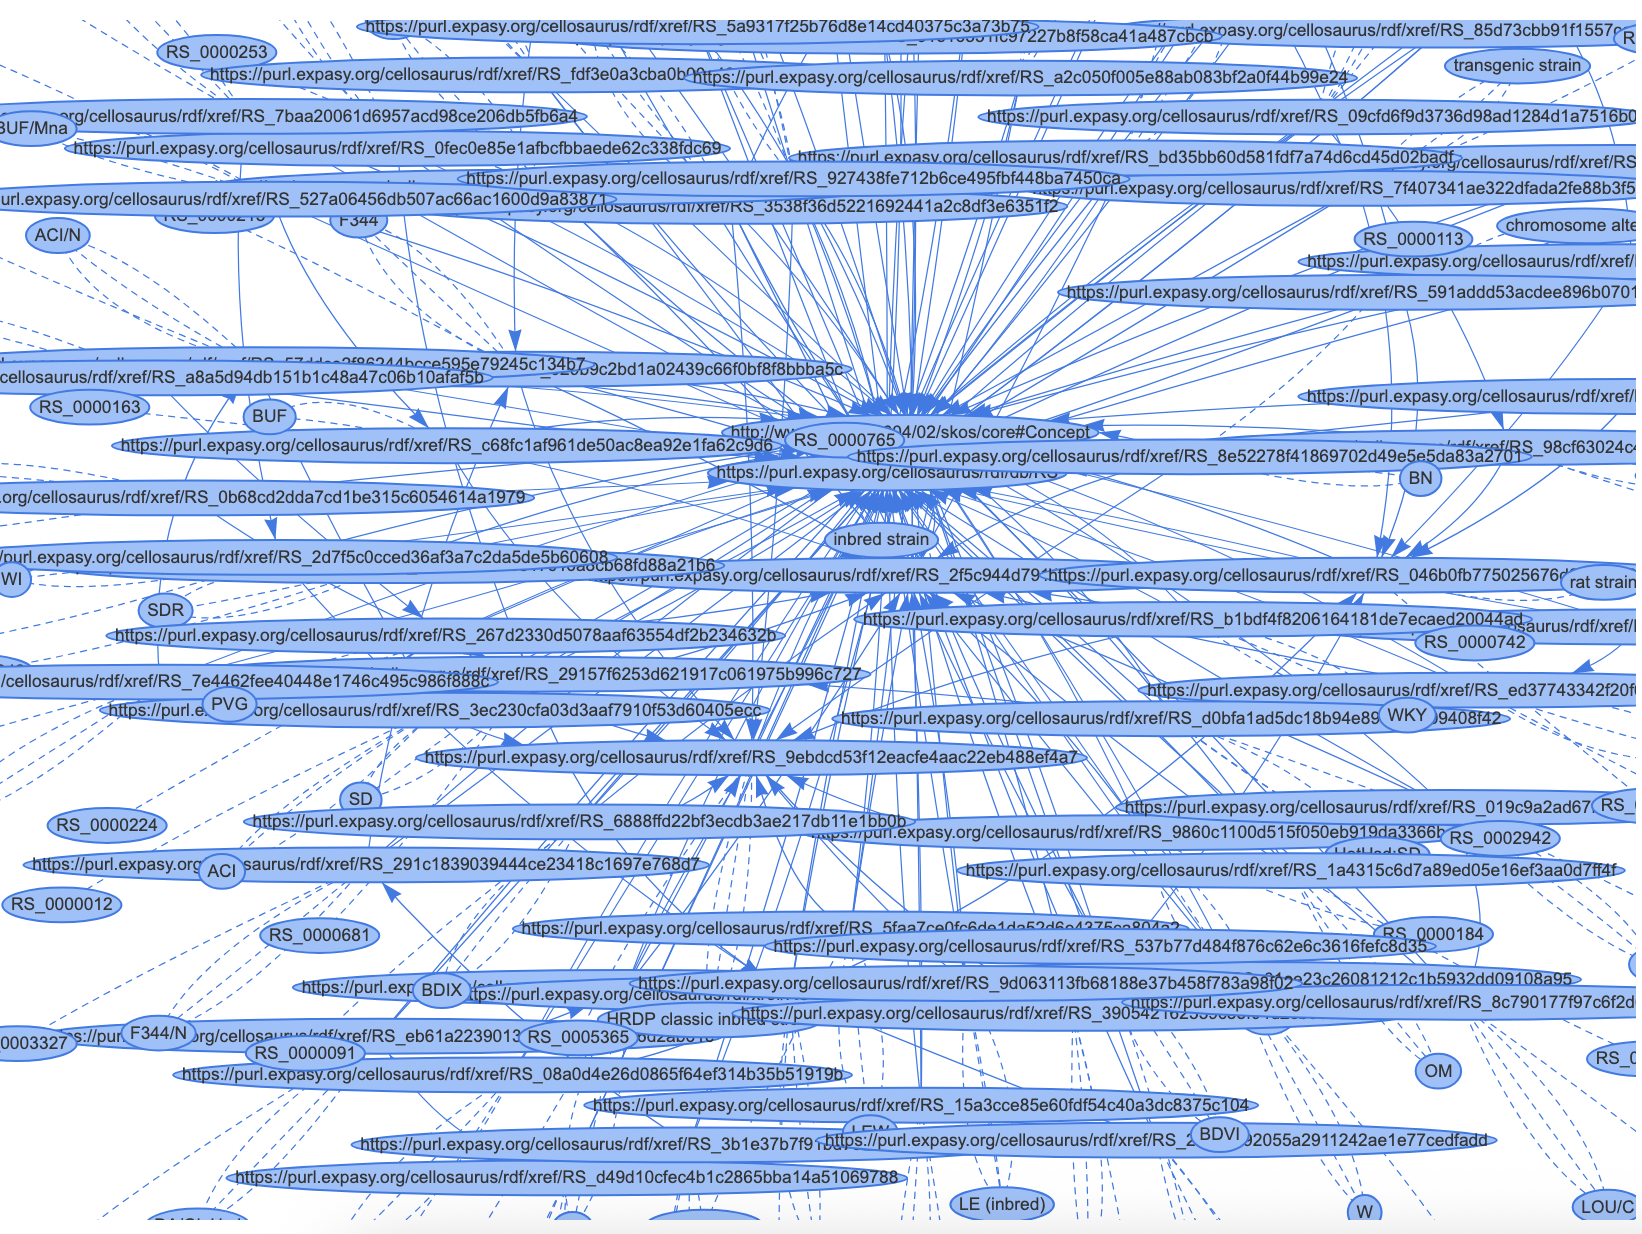
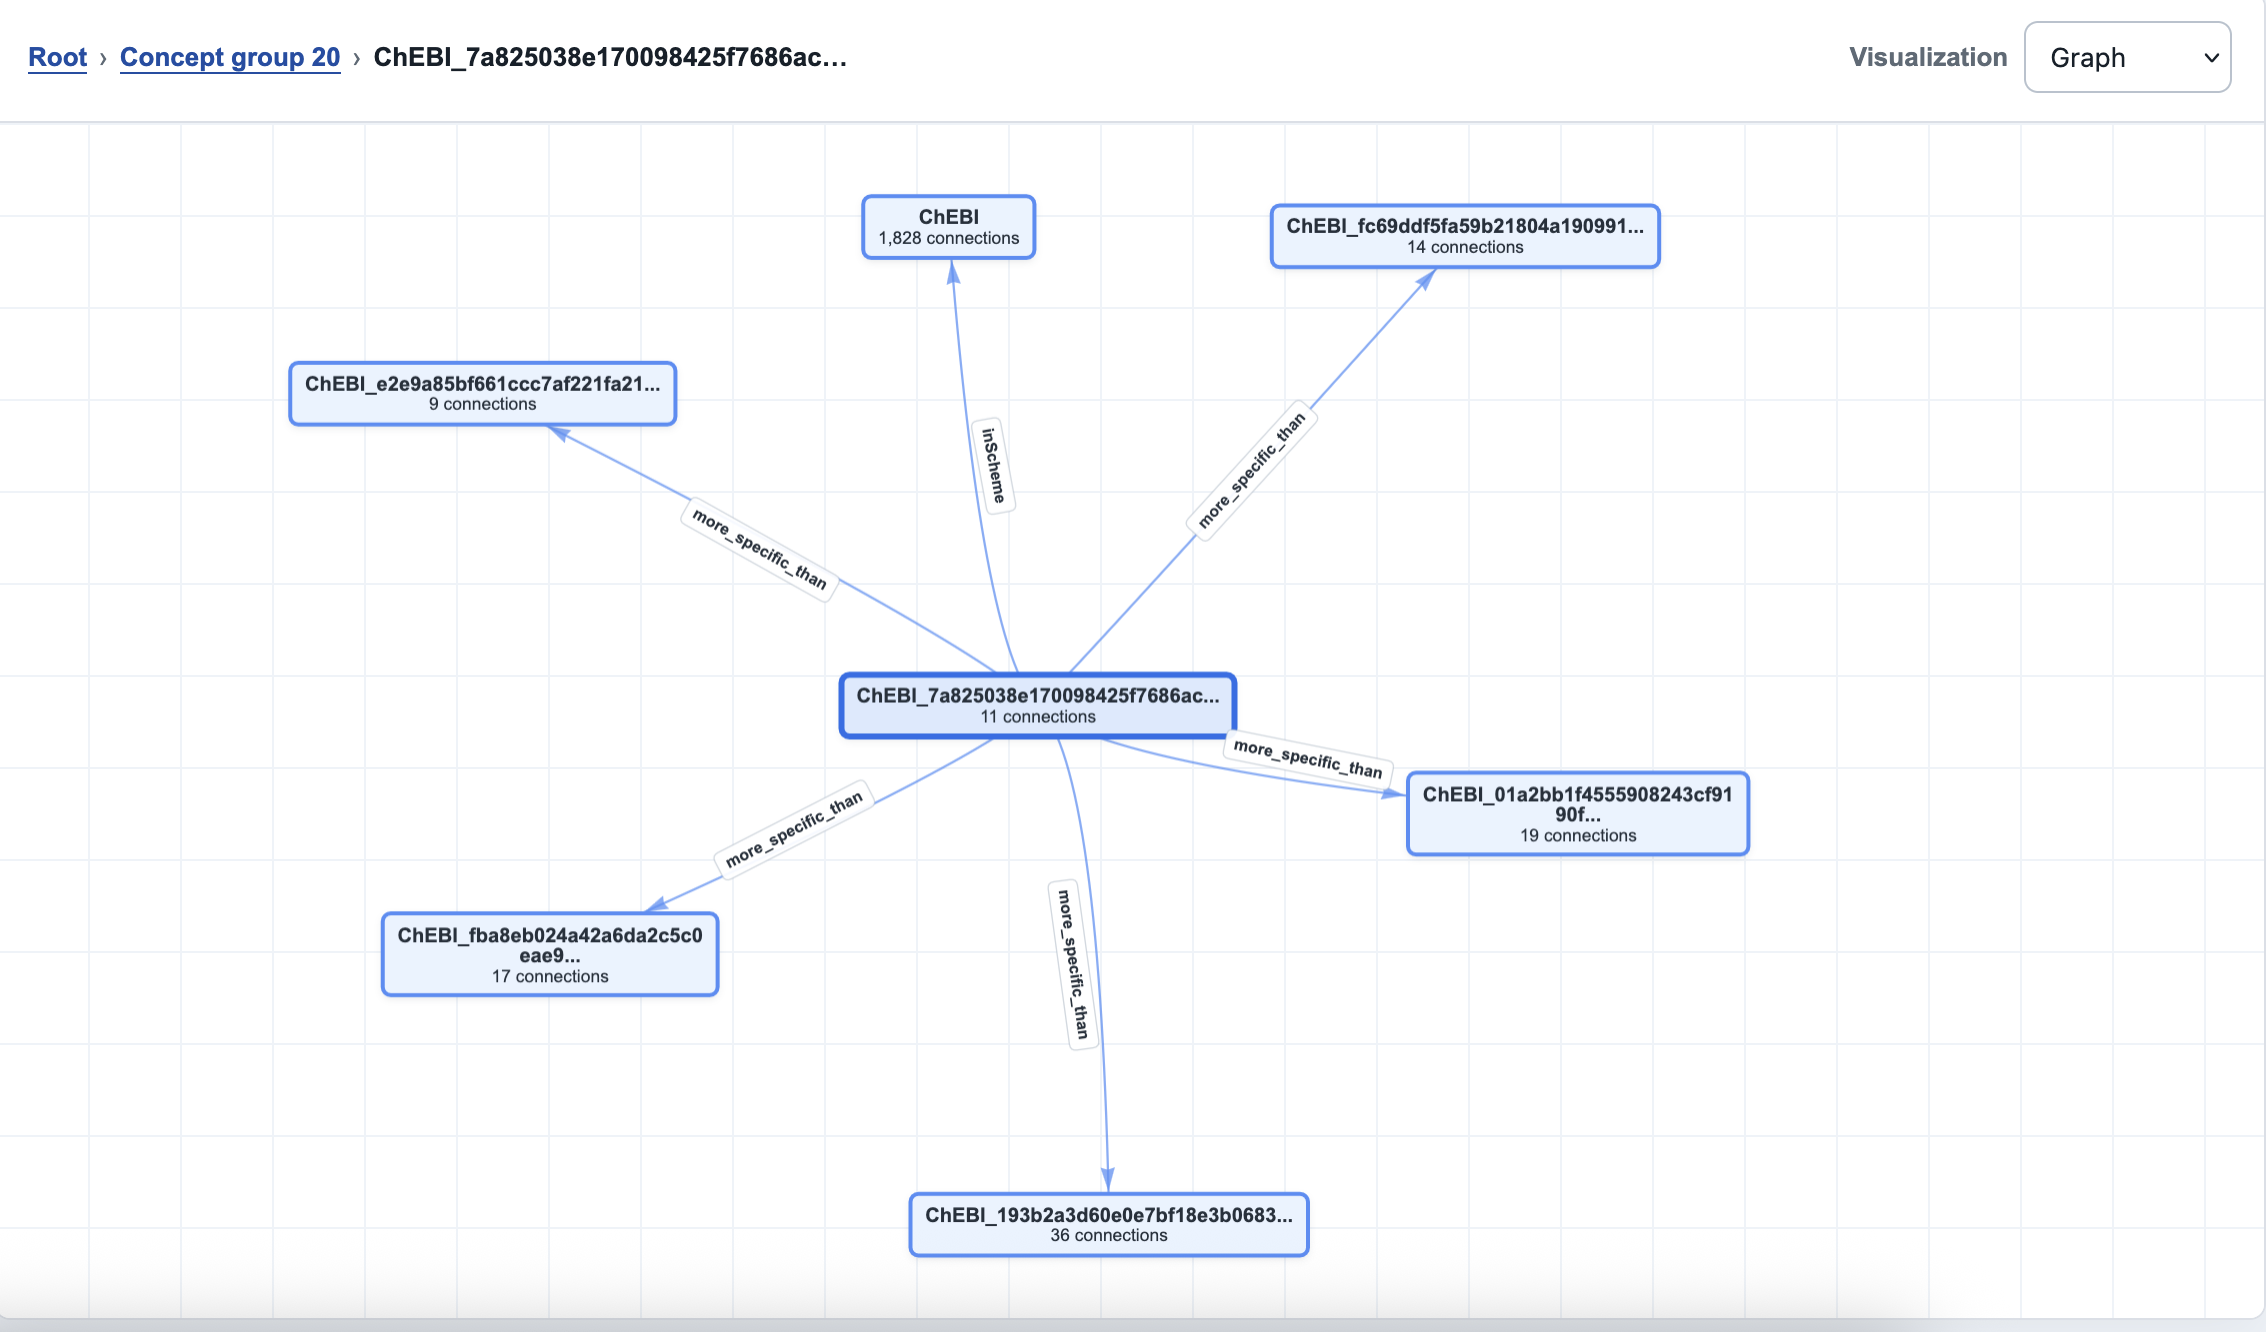
The clustering view keeps the big picture intact while preserving a path into the details. Start with semantic neighborhoods, open a cluster, then switch naturally into readable tables when resources share attributes.
Import validation
Every import is checked for RDF syntax problems, parser repairs, and common data-quality concerns. A dedicated validation report separates fatal errors from warnings and informational lint, with the affected statements kept close at hand.
See whether the complete file parsed, understand any recovery RDF Visualizer performed, filter repeated findings by category, and export the report for follow-up—all.
An xsd:date value contains an invalid calendar date.
Add an explicit base IRI to keep identifiers portable.
The same predicate links to both literals and resources.
When you purchase RDF Visualizer, you get your own copy of the software: a self-contained browser app you can download, keep, and run offline. Your files stay on your machine, and we do not require an always-online account just to use the tool.
One-time purchase: $19.99.
Pay once with Stripe and get the browser-based RDF visualizer. This is not an always-online SaaS subscription — the app runs entirely in your browser.
Satisfaction guaranteed. Email [email protected] for a refund, no questions asked.